TAMARIN PROVER
The user interface for the graph rendering now features appealing colors, icons and fonts. It also offers enhanced functionalities for efficient navigation.
TYPE
Research software
TOPIC
Tamarin Prover, Redesign User Interface
YEAR
2023
SOFTWARE
Tamarin Prover, Figma, React, TypeScript, Haskell, Jetbrains IntelliJ Ultimate
SKILLS
User Research, Usability Testing, Conceptual Design, Visual Design, Prototyping, Software Design, Research Software Engineering
This project involved the redesign and redevelopment of the rendering of graphs in the user interface of the Tamarin Prover.
The new tool replaces the previous display of graphs as static images and instead generates dynamic graphs rendered by the browser in SVG/HTML/CSS. This allows for interactive analyses of the result graphs produced by the Tamarin Prover protocol proof system, enabling high-performance navigation even in complex graphs. The implementation is based on React (TypeScript) with MUI.
The Tamarin Prover is a tool for modeling and analyzing security protocols. The software features a web-based user interface for analysis. In this interface, the representation of graphs plays a major role. These graphs show the flow of the protocol, usually in different sections.
Previously, the tool had displayed graphs as static images. The task at hand was to revise the way it represented graphs and to make them accessible to users in an interactive fashion.
The new interface for graphs was designed with as little reference as possible to the old front-end. We involved the users of the Tamarin Prover in the design process and discussed our ideas with them.
The design of the new interface includes all the basics: colors, icons, fonts and a consistent design.
New features were developed as well:
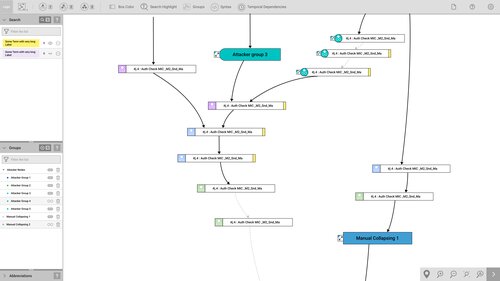
Detailed concept as a wideframe
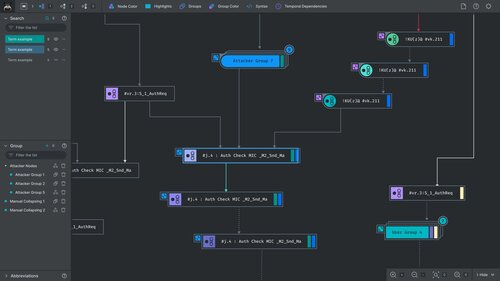
The finished visual design (1/2)
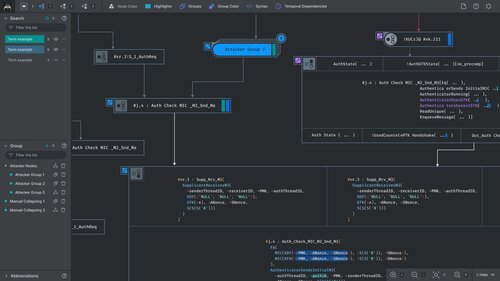
The finished visual design (2/2)
It was clear from the beginning that the new tool would be part of the existing Tamarin Prover front-end. The front-end is based on a webview, so the new tool, too, had to be implemented with HTML, SVG, CSS and JavaScript. To make development more convenient and secure, we used Typescript instead of Javascript. The entire application is ultimately based on React. The following key technologies and libraries were used:
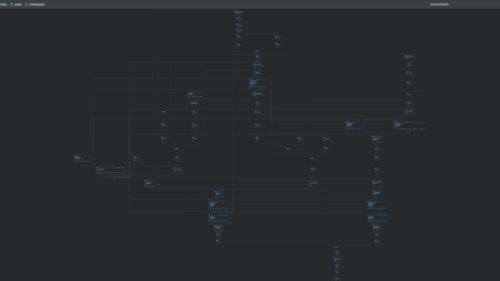
The biggest challenge was the layouting and rendering of the graph. The graph is transferred from the backend as JSON and parsed. Afterwards, the graph needs to be displayed clearly, correctly and in a visually appealing way.
The implementation was based on the algorithm of the dot graph rendering. In short, the graph is loaded and then analyzed. Based on their relationships , the graph nodes are sorted into a grid from bottom to top. Then, the edges are segmented and, if necessary, invisible auxiliary nodes are inserted into the graph to guide the edges correctly.
The analyzed and structured graph is rendered as a hierarchy of React components in a SVG component. The inside of the nodes is HTML in the SVG.
A graph in the new Tamarin Graph front-end.
Navigation
Users can move the graph using the mouse. It is also possible to zoom in and out using either the mouse or buttons. The view can also be reset.
Levels of detail
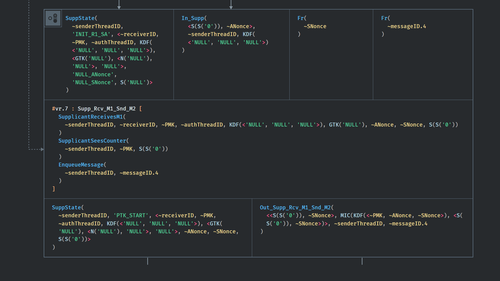
The nodes of the graph can be displayed in three different levels of detail.
Level of detail 1: Only the name of the node is displayed.
Level of detail 2: The names of the premises, conclusions and actions are also displayed.
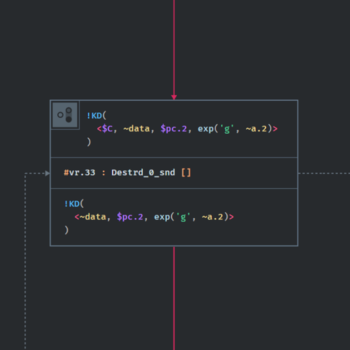
Level of detail 3: The complete parameters are displayed (most detailed representation of a node).